
Everything you need for bomb calorimetry — already built in.
The DDS Calorimeters advanced PC software ships with the tools most labs spend hours looking for: real-time live parameters, comprehensive event logging to seamless LIMS integration and much more, everything is included at no additional cost. Experience the software yourself with a free demo and download it for free today.
Everything you need for bomb calorimetry — already built in.
The DDS Calorimeters advanced PC software ships with the tools most labs spend hours looking for: real-time live parameters, comprehensive event logging to seamless LIMS integration and much more, everything is included at no additional cost. Experience the software yourself with a free demo and download it for free today.
Everything you need for bomb calorimetry — already built in.
The DDS Calorimeters advanced PC software ships with the tools most labs spend hours looking for: real-time live parameters, comprehensive event logging to seamless LIMS integration and much more, everything is included at no additional cost. Experience the software yourself with a free demo and download it for free today.
INCLUDED FEATURES
One software.
Every capability your lab expects.
The DDS advanced PC software is free with every CAL3K calorimeter. No add-ons, no plugins — it's all in the box.
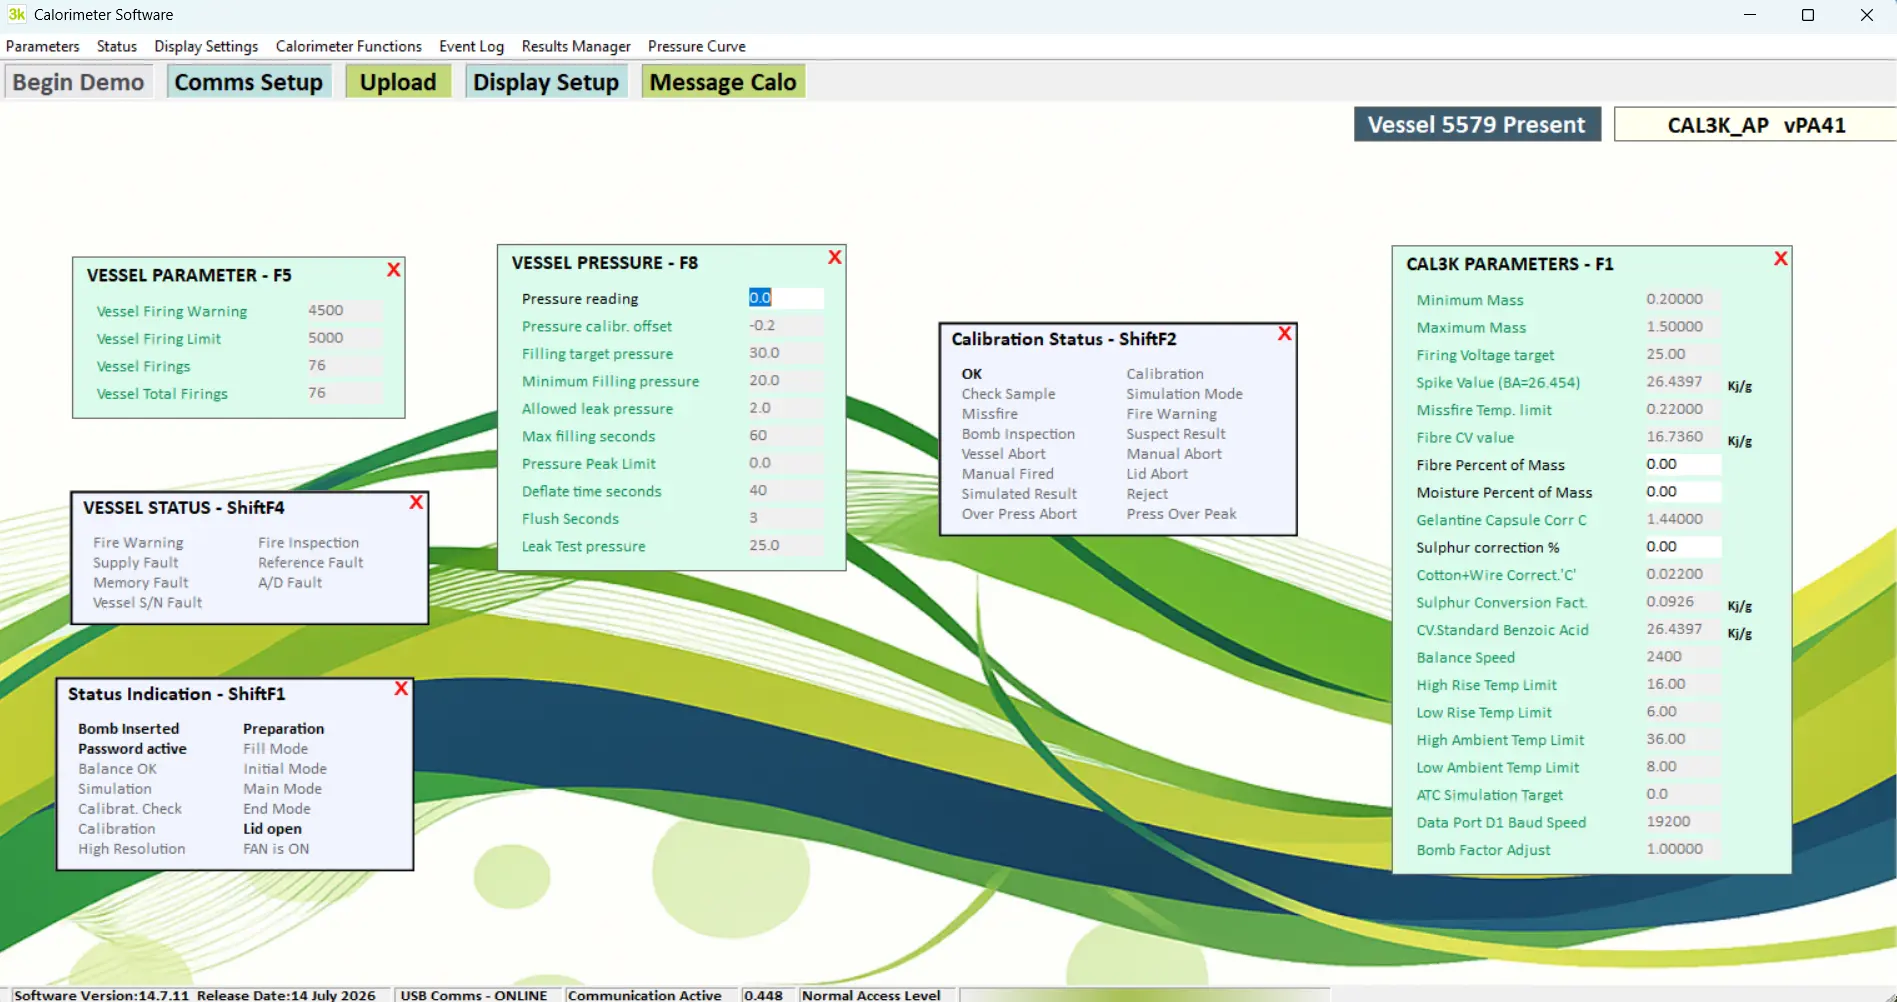
Live Parameters
Take complete control of your active testing environment. The Live Parameters module provides a direct, real-time feed from your connected CAL3K, giving you instant visibility into critical metrics like benzoic acid standard value, spiking parameters, etc.

Display Setup
Experience unparalleled flexibility and precision with our Live Display interface. Treat your screen as a blank digital canvas where you can open, drag, and overlay individual data windows exactly as you need them. Not only does this workspace adapt perfectly to your workflow, but it also delivers absolute real-time performance.
- True Real-Time Data: Watch your parameters and status fields update every 0.5 seconds. What you see is guaranteed to be 100% accurate and up-to-date. Live is truly live, all the time.
- Instantaneous Command: Every keystroke or parameter adjustment is sent immediately to the calorimeter for an instant physical reaction, giving you seamless, zero-lag control over your processes.
- Task-Specific Workspaces: Instantly switch contexts by saving custom layouts for specific tasks, such as "Calibration Info," "Parameter Setup," or "Detailed Pressure Analysis."
- Seamless Multi-User Support: Sharing a calorimeter in a busy lab or university? Operators and students can save their own personalized layouts (e.g., "Mike's Screens"), and the software will automatically remember exact screen placements upon startup.

Display Setup
Experience unparalleled flexibility and precision with our Live Display interface. Treat your screen as a blank digital canvas where you can open, drag, and overlay individual data windows exactly as you need them. Not only does this workspace adapt perfectly to your workflow, but it also delivers absolute real-time performance.
- True Real-Time Data: Watch your parameters and status fields update every 0.5 seconds. What you see is guaranteed to be 100% accurate and up-to-date. Live is truly live, all the time.
- Instantaneous Command: Every keystroke or parameter adjustment is sent immediately to the calorimeter for an instant physical reaction, giving you seamless, zero-lag control over your processes.
- Task-Specific Workspaces: Instantly switch contexts by saving custom layouts for specific tasks, such as "Calibration Info," "Parameter Setup," or "Detailed Pressure Analysis."
- Seamless Multi-User Support: Sharing a calorimeter in a busy lab or university? Operators and students can save their own personalized layouts (e.g., "Mike's Screens"), and the software will automatically remember exact screen placements upon startup.
Graphing of Live Data
Gain deep, customizable insights into your calorimeter’s performance with our Visual Live Data module. The software gives you complete control to select, scale, rename, and color-code critical live metrics—such as vessel temperature, vessel drift, ambient temperature, and pressure. Tailor your dashboard to your exact analytical needs by choosing from four dynamic display formats for any given value: Small Display, Large Display, Bar Graph, or a dynamic Graphing view.
- Live "Ticker Tape" Graphing: Plot up to 8 unique, color-coded data traces simultaneously on a rolling 7-minute visual graph.
- Interactive Historical Tracking: Because events happen in a flash when a vessel fires a sample, you can simply click directly on any graphed line to instantly reveal its historical value. Automated CSV Logging: The moment a vessel is placed into the bomb well, the software automatically begins recording all values to a dedicated CSV file.
- Advanced Sample Comparison: Easily export your individual vessel data files into Excel to transpose and overlay multiple graphs, giving you a crystal-clear understanding of the differences between various samples.

Graphing of Live Data
Gain deep, customizable insights into your calorimeter’s performance with our Visual Live Data module. The software gives you complete control to select, scale, rename, and color-code critical live metrics—such as vessel temperature, vessel drift, ambient temperature, and pressure. Tailor your dashboard to your exact analytical needs by choosing from four dynamic display formats for any given value: Small Display, Large Display, Bar Graph, or a dynamic Graphing view.
- Live "Ticker Tape" Graphing: Plot up to 8 unique, color-coded data traces simultaneously on a rolling 7-minute visual graph.
- Interactive Historical Tracking: Because events happen in a flash when a vessel fires a sample, you can simply click directly on any graphed line to instantly reveal its historical value. Automated CSV Logging: The moment a vessel is placed into the bomb well, the software automatically begins recording all values to a dedicated CSV file.
- Advanced Sample Comparison: Easily export your individual vessel data files into Excel to transpose and overlay multiple graphs, giving you a crystal-clear understanding of the differences between various samples.
Vessel Pressure Curve
When it comes to pressure, all the critical action happens in the first few seconds. Because of the sheer volume of data generated, the calorimeter records the latest high-density pressure event as a single, incredibly detailed record. Our software captures an astounding 2,000 data points within just the first 16 seconds after firing, giving you unparalleled insight into ignition speeds—a critical metric for propellants and recycling sample analysis.
- High-Density Zooming: Take advantage of the extreme recording density by zooming directly into the graphed data, allowing you to visually compare rapidly changing pressure differences split-second by split-second.
- Standardized Averaging & Normalization: Just like our temperature module, you can create a standard "Average" pressure curve, or "Normalize" your graphs to compare the pressure rise per gram regardless of the sample's mass.
- Secure, Modular File Sharing: Every high-density pressure curve is saved as an independent file. Share and analyze critical ignition profiles across different calorimeters without transferring sensitive sample data.
- Annotate and Export: Double-click any curve to append essential contextual notes for future reference. Export your data to CSV for external Excel analysis, or save your zoomed-in graphs directly as PDFs.

Vessel Pressure Curve
When it comes to pressure, all the critical action happens in the first few seconds. Because of the sheer volume of data generated, the calorimeter records the latest high-density pressure event as a single, incredibly detailed record. Our software captures an astounding 2,000 data points within just the first 16 seconds after firing, giving you unparalleled insight into ignition speeds—a critical metric for propellants and recycling sample analysis.
- High-Density Zooming: Take advantage of the extreme recording density by zooming directly into the graphed data, allowing you to visually compare rapidly changing pressure differences split-second by split-second.
- Standardized Averaging & Normalization: Just like our temperature module, you can create a standard "Average" pressure curve, or "Normalize" your graphs to compare the pressure rise per gram regardless of the sample's mass.
- Secure, Modular File Sharing: Every high-density pressure curve is saved as an independent file. Share and analyze critical ignition profiles across different calorimeters without transferring sensitive sample data.
- Annotate and Export: Double-click any curve to append essential contextual notes for future reference. Export your data to CSV for external Excel analysis, or save your zoomed-in graphs directly as PDFs.
Vessel Temperature Curve
Unlock advanced insights into your samples' burning characteristics and over-temperature rises. Our software seamlessly uploads the last 16 firing temperature curves directly from any of our calorimeter models, providing a comprehensive toolkit for advanced thermal analysis and historical comparison.
- Standardized Averaging: Create and name a custom "Average" temperature curve to establish a reliable baseline. This allows you to instantly visualize exactly how and where subsequent samples deviate from your standard.
- Normalized Mass Comparisons: Need to compare samples of vastly different weights? "Normalize" your graphs to view the true comparative temperature rise per gram, eliminating variables caused by sample mass.
- Smart Sync & Housekeeping: Upload your calorimeter's 16 stored curves as often as you like. The software automatically checks for duplicates to prevent clutter, while offering easy deletion tools to keep your library organized.
- Secure, Modular File Sharing: Every temperature curve is saved as an independent file. This allows you to easily share and analyze firing profiles across different calorimeters without transferring sensitive sample data or extra "baggage."
- Annotate and Export: Double-click any curve to append essential contextual notes (e.g., "Weight captured by adjacent lab"). When you are ready to report, export your data to CSV for Excel analysis or save the graphs directly as PDFs.

Vessel Temperature Curve
Unlock advanced insights into your samples' burning characteristics and over-temperature rises. Our software seamlessly uploads the last 16 firing temperature curves directly from any of our calorimeter models, providing a comprehensive toolkit for advanced thermal analysis and historical comparison.
- Standardized Averaging: Create and name a custom "Average" temperature curve to establish a reliable baseline. This allows you to instantly visualize exactly how and where subsequent samples deviate from your standard.
- Normalized Mass Comparisons: Need to compare samples of vastly different weights? "Normalize" your graphs to view the true comparative temperature rise per gram, eliminating variables caused by sample mass.
- Smart Sync & Housekeeping: Upload your calorimeter's 16 stored curves as often as you like. The software automatically checks for duplicates to prevent clutter, while offering easy deletion tools to keep your library organized.
- Secure, Modular File Sharing: Every temperature curve is saved as an independent file. This allows you to easily share and analyze firing profiles across different calorimeters without transferring sensitive sample data or extra "baggage."
- Annotate and Export: Double-click any curve to append essential contextual notes (e.g., "Weight captured by adjacent lab"). When you are ready to report, export your data to CSV for Excel analysis or save the graphs directly as PDFs.
Result Manager
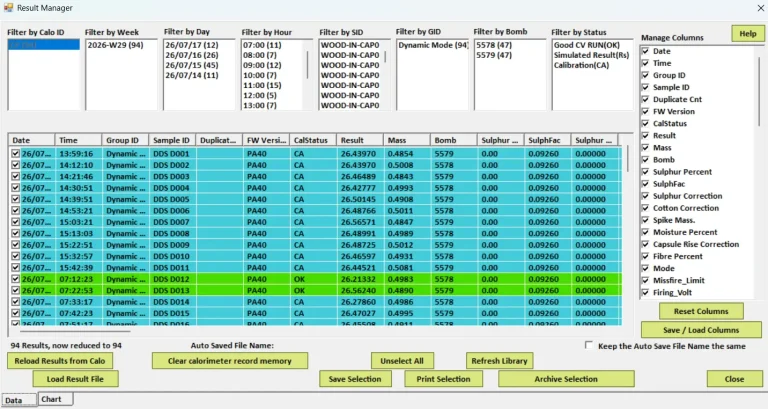
What good is determining the energy of an unknown substance if you cannot easily export, graph, and compare your results? The Result Manager is the ultimate analytical hub for your DDS calorimeter. Because the hardware can store between 100 and 450 records, it can operate independently without a PC for weeks. When you are ready to download, the software automatically checks for duplicates and securely saves each uniquely identifiable record into your library.
- Comprehensive Environmental Capture: Each result record captures an incredible amount of background data. The entire environment at the exact time of the result is saved, giving you the complete picture for later evaluation.
- Seamless LIMS Integration: For compliance-focused labs, all downloaded results are automatically appended to a standardized CSV file, ready for instant import into your Laboratory Information Management System (LIMS).
- Dynamic Data Filtering: Easily manage large data sets by organizing your results using 8 distinct filters: Week, Day, Hour, Sample ID, Group ID, Vessel Number, and Status.
- Customizable Views & Workspaces: Color-coded records (e.g., calibration, normal CV, misfire) make scanning easy. You can also hide specific data headers to declutter your screen, save these custom layouts, and print them. (For example, educators can hide the "Final Result" column so students must manually calculate it from raw input values).
- Advanced Visual Graphing: Select a batch of results and instantly graph relationships between specific data points—such as Net Rise versus Firing Temperature. This makes it incredibly easy to spot trends and understand why results might differ by day, week, or vessel. Export your final graphs to PDF with a single click.
Result Manager
What good is determining the energy of an unknown substance if you cannot easily export, graph, and compare your results? The Result Manager is the ultimate analytical hub for your DDS calorimeter. Because the hardware can store between 100 and 450 records, it can operate independently without a PC for weeks. When you are ready to download, the software automatically checks for duplicates and securely saves each uniquely identifiable record into your library.
- Comprehensive Environmental Capture: Each result record captures an incredible amount of background data. The entire environment at the exact time of the result is saved, giving you the complete picture for later evaluation.
- Seamless LIMS Integration: For compliance-focused labs, all downloaded results are automatically appended to a standardized CSV file, ready for instant import into your Laboratory Information Management System (LIMS).
- Dynamic Data Filtering: Easily manage large data sets by organizing your results using 8 distinct filters: Week, Day, Hour, Sample ID, Group ID, Vessel Number, and Status.
- Customizable Views & Workspaces: Color-coded records (e.g., calibration, normal CV, misfire) make scanning easy. You can also hide specific data headers to declutter your screen, save these custom layouts, and print them. (For example, educators can hide the "Final Result" column so students must manually calculate it from raw input values).
- Advanced Visual Graphing: Select a batch of results and instantly graph relationships between specific data points—such as Net Rise versus Firing Temperature. This makes it incredibly easy to spot trends and understand why results might differ by day, week, or vessel. Export your final graphs to PDF with a single click.
Event Logging
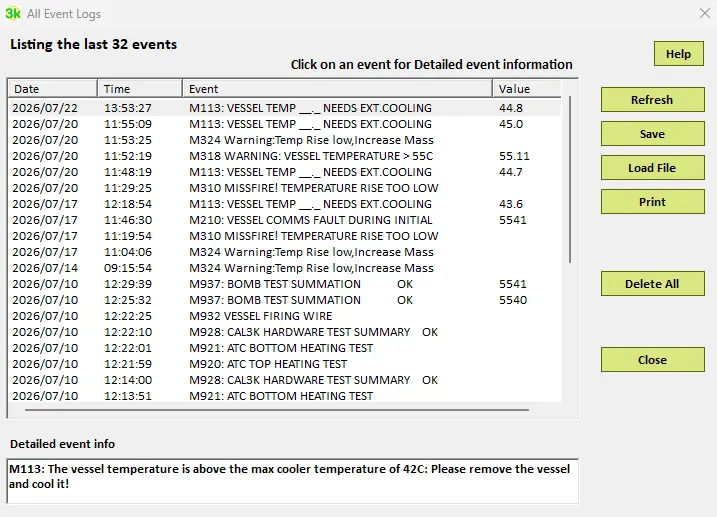
Maintain absolute confidence in your results with our robust Event Logging system. Every critical event or error the calorimeter encounters during operation is securely stored in the event register. Because a seemingly minor issue—like a fluctuating ambient temperature reading—can silently skew your final results, the event log is your most vital tool for ensuring data integrity and rapid troubleshooting.
- Deep-Dive Diagnostics: Click on any logged event to reveal highly detailed diagnostic information, helping you determine if the issue requires a simple limit adjustment or deeper intervention.
- Trace Cascading Errors: Serious warnings often trigger a chain reaction of subsequent errors. The event log allows you to trace the timeline backward to accurately identify and resolve the root cause.
- Infinite Software Archiving: While the calorimeter hardware stores the 32 most recent events, the software allows you to seamlessly download, save, and recall these logs to a file. This creates an unlimited historical archive for auditing and future troubleshooting.
- Proactive Quality Control: By routinely checking the event log after a machine warning, you can catch and resolve environmental or hardware deviations before they impact a larger batch of sample results.
Event Logging
Maintain absolute confidence in your results with our robust Event Logging system. Every critical event or error the calorimeter encounters during operation is securely stored in the event register. Because a seemingly minor issue—like a fluctuating ambient temperature reading—can silently skew your final results, the event log is your most vital tool for ensuring data integrity and rapid troubleshooting.
- Deep-Dive Diagnostics: Click on any logged event to reveal highly detailed diagnostic information, helping you determine if the issue requires a simple limit adjustment or deeper intervention.
- Trace Cascading Errors: Serious warnings often trigger a chain reaction of subsequent errors. The event log allows you to trace the timeline backward to accurately identify and resolve the root cause.
- Infinite Software Archiving: While the calorimeter hardware stores the 32 most recent events, the software allows you to seamlessly download, save, and recall these logs to a file. This creates an unlimited historical archive for auditing and future troubleshooting.
- Proactive Quality Control: By routinely checking the event log after a machine warning, you can catch and resolve environmental or hardware deviations before they impact a larger batch of sample results.
NCV: Streamlined Compliance and Advanced Reporting
For laboratories required to conform to strict international standards—including ISO 1928, DIN 51900, ASTM D5865, GB/T 213-2008, GOST 147-2013, and JIS M 8814—the Net Calorific Value (NCV) module is an indispensable tool. Seamlessly validate your samples, apply ultimate analysis data, and generate audit-ready reports in a matter of seconds.
- Automated Replicate Validation: Select up to four replicates (as per ISO and DIN standards) and instantly see if your selection passes or fails the strict 0.12 MJ/Kg limit. The software automatically calculates the Mean HHV (Gross Value) for further use.
- Time-Saving Data Profiles: Save your standard "ultimate analysis" lab reports—including Hydrogen, Oxygen, Nitrogen, Ash, and Carbon percentages—for quick loading, eliminating repetitive manual data entry. Moisture and Sulphur are automatically pulled from the calorimeter but can be easily edited.
- One-Click Calculations: A single click on 'Calculate NCV' runs all complex calculations required by international standards and generates a comprehensive on-screen report.
- Audit & Calibration Verification: Prove your analytical accuracy by appending a Calibration Check that verifies the validity, age, and RSD of the calibration supporting your analysis. You can also capture and log your used Benzoic Acid CRM details.
- Customizable & Export-Ready: Toggle individual sections on or off to build the perfect report, then simply copy and paste the final output directly onto your company letterhead.

NCV: Streamlined Compliance and Advanced Reporting
For laboratories required to conform to strict international standards—including ISO 1928, DIN 51900, ASTM D5865, GB/T 213-2008, GOST 147-2013, and JIS M 8814—the Net Calorific Value (NCV) module is an indispensable tool. Seamlessly validate your samples, apply ultimate analysis data, and generate audit-ready reports in a matter of seconds.
- Automated Replicate Validation: Select up to four replicates (as per ISO and DIN standards) and instantly see if your selection passes or fails the strict 0.12 MJ/Kg limit. The software automatically calculates the Mean HHV (Gross Value) for further use.
- Time-Saving Data Profiles: Save your standard "ultimate analysis" lab reports—including Hydrogen, Oxygen, Nitrogen, Ash, and Carbon percentages—for quick loading, eliminating repetitive manual data entry. Moisture and Sulphur are automatically pulled from the calorimeter but can be easily edited.
- One-Click Calculations: A single click on 'Calculate NCV' runs all complex calculations required by international standards and generates a comprehensive on-screen report.
- Audit & Calibration Verification: Prove your analytical accuracy by appending a Calibration Check that verifies the validity, age, and RSD of the calibration supporting your analysis. You can also capture and log your used Benzoic Acid CRM details.
- Customizable & Export-Ready: Toggle individual sections on or off to build the perfect report, then simply copy and paste the final output directly onto your company letterhead.
Demo
Familiarize your team with the system without burning a single sample. The Demo module lets you run a fully simulated cycle, allowing you to seamlessly train staff, teach students, or thoroughly evaluate the software's capabilities offline.
Please Note: Any calorimeters purchased before November 2025 will be using Version 13 CAL3K Software.
